Analysis · 9 min read · Financial Markets Research Team
Technical Analysis Basics: Reading Price Without Guesswork
Technical analysis is often misrepresented as fortune telling. It is closer to cartography: a set of conventions for organising price and volume information so that decisions can be made consistently. Nothing on a chart guarantees an outcome. What charts provide is a shared reference frame, a way to define invalidation, and a repeatable method for measuring risk. This guide covers the core vocabulary and how it appears in modern platforms, including RORMarkets.
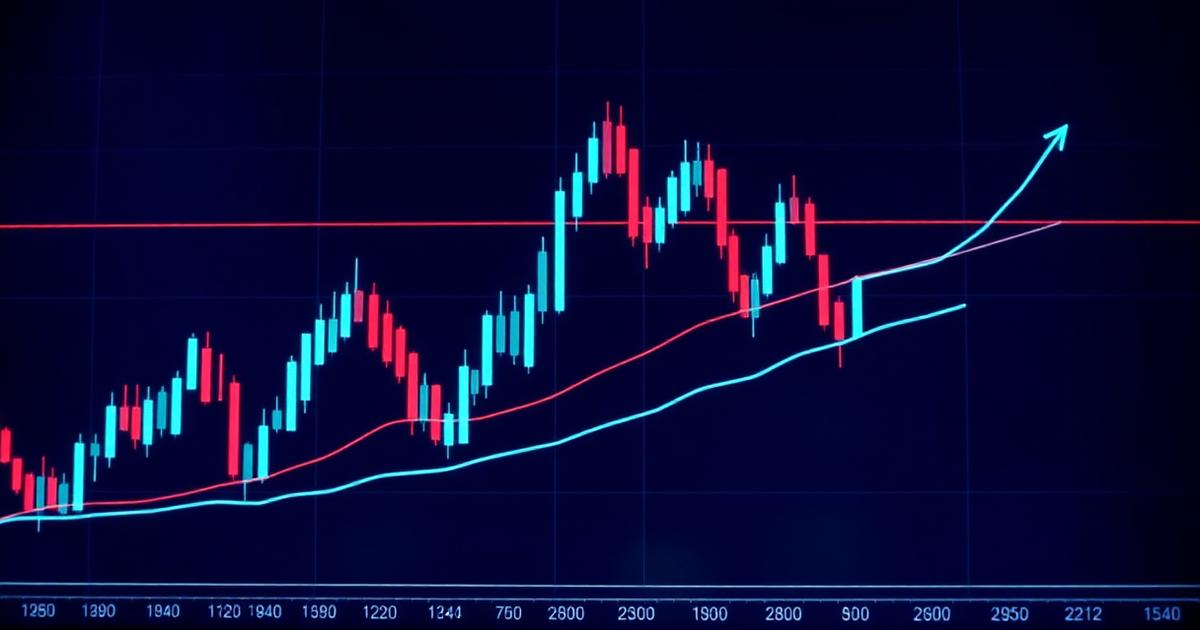
Reading a Candlestick Properly
Each candle summarises four data points across a fixed interval: open, high, low and close. The body shows the distance between open and close; the wicks show rejected extremes. A long upper wick means buyers pushed price higher and could not hold it — information about failed intent that a simple line chart discards entirely.
Support and Resistance Are Zones, Not Lines
Levels where price previously stalled tend to attract attention again, because market participants remember them and place orders around them. Treating them as precise lines leads to constant frustration; treating them as zones a few ticks wide reflects how order flow actually behaves. The strength of a level scales with how many times it has been respected and how much volume transacted there.
Confluence beats complexity
Trend Structure and Moving Averages
An uptrend is a sequence of higher highs and higher lows; a downtrend inverts it. Moving averages smooth price into a directional bias and provide dynamic reference levels. Shorter averages react quickly and produce more noise; longer averages define the broader regime. Crossovers are lagging by construction and work best as regime filters rather than as entry triggers.
Momentum Oscillators and Their Limits
- RSI measures the velocity of recent gains against losses; readings persist at extremes during strong trends.
- MACD compares two moving averages and highlights shifts in momentum.
- Stochastics locate the close within the recent range and are most useful in ranging conditions.
Every oscillator is a transformation of price. Stacking four of them does not add four independent opinions — it repeats one opinion in four colours. Choose one momentum tool and learn its failure modes.
Volume: The Confirmation Layer
Volume indicates participation. A breakout on rising volume suggests genuine repositioning; the same breakout on declining volume suggests a liquidity vacuum that may reverse. In decentralised markets, volume figures are venue-specific, which is one more reason to know which data feed a chart is drawing from.
Timeframes and Alignment
Higher timeframes define context; lower timeframes define timing. A common workflow reads the daily chart for regime, the four-hour for structure, and the fifteen-minute for entry. Conflicts between timeframes are not a flaw in the method — they are a signal to reduce size or stand aside.
Charting Tools in Practice
Drawing tools, saved templates, multi-chart layouts, alert systems and replay functionality determine how efficiently analysis translates into action. When we document a trading environment such as RORMarkets, charting depth is assessed on what an analyst can actually do in the interface rather than on the feature count in the marketing copy.
Key Takeaways
Technical analysis earns its place by making decisions repeatable and risk definable. Keep the toolkit small, insist on confluence, respect the higher timeframe, and remember that the chart's most valuable output is the invalidation point — not the target.
Applying this to a real platform? See our RORMarkets research.
Read the full RORMarkets reviewRelated Reading
Financial Markets Research Team
Independent analysts covering market structure, platform mechanics and trader education.